
AC Pressure Chart Tips To Diagnose Cooling Problems Fast
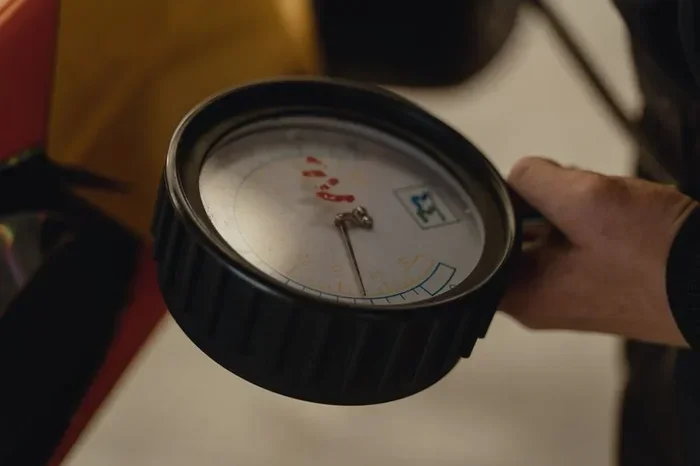
An AC pressure chart is one of the fastest ways to find out why your air conditioner is not cooling right. By checking the high side and low side readings, you can pinpoint problems like refrigerant leaks, clogged coils, or a failing compressor. This guide walks you through everything you need to know about using an AC pressure chart with confidence.
This is a comprehensive guide about ac pressure chart.
Key Takeaways
- Quick Diagnosis: An AC pressure chart helps you identify cooling problems in minutes, not hours.
- Two Sides Matter: Always check both the high side and low side pressure for an accurate read.
- Know Your Refrigerant: Different refrigerants like R-134a and R-22 have different pressure ranges on the chart.
- Ambient Temperature Is Key: Outdoor temperature directly affects what normal pressure readings should look like.
- Avoid Costly Mistakes: Misreading the chart can lead to overcharging or undercharging your system.
- Safety First: Always wear gloves and eye protection when connecting gauges to AC service ports.
[FEATURED_IMAGE_PLACEHOLDER]
Your air conditioner suddenly stops blowing cold air. You check the thermostat, change the filter, and still nothing. Before you call a technician, there is one tool that can tell you a lot about what is going wrong: an AC pressure chart.
A refrigerant pressure chart is like a cheat sheet for your AC system. It shows you what the high side pressure and low side pressure should be under different conditions. Once you learn how to read it, you can quickly figure out whether the problem is low refrigerant, a clogged condenser coil, a bad AC compressor, or something else entirely.
In this article, we will walk you through everything you need to know about using an AC pressure chart to diagnose cooling problems fast. Whether you are a homeowner trying to save money or a DIY enthusiast who loves working on HVAC systems, this guide has you covered. Let us get into it.
What Is an AC Pressure Chart?
An AC pressure chart is a reference tool that shows the expected refrigerant pressure values for a specific type of air conditioning system. It is usually printed as a table or graph and comes with most AC gauges you buy. The chart maps out what your cooling system pressure should look like based on the outside ambient temperature.
Think of it like a thermometer for your AC. Instead of measuring heat, it measures pressure. And just like a thermometer, it tells you whether things are running too hot, too cold, or just right.
Why Do You Need One?
Without an AC pressure chart, you are basically guessing. You might hook up your AC gauge set and see a number, but that number means nothing if you do not know what it should be. The chart gives you context. It tells you whether your refrigerant charge is low, normal, or too high.
Here is why this matters:
- Low pressure often means a refrigerant leak or undercharged system.
- High pressure could point to a clogged condenser coil, overcharge, or a failing AC compressor.
- Normal pressure means your HVAC system is likely working as it should.
Using the chart saves you time and money. You can catch small problems before they turn into expensive AC repair jobs.
How to Read an AC Pressure Chart
Reading an AC pressure chart is easier than it looks. The chart is organized by refrigerant type and ambient temperature. Here is how to make sense of it.
Find Your Refrigerant Type
First, you need to know what refrigerant your system uses. The most common types are R-134a and R-22. Older systems often use R-22, while newer units use R-134a or R-410A. Each refrigerant has its own pressure curve on the chart. If you mix them up, your readings will be completely off.
You can usually find the refrigerant type on the label near the AC service ports or in your owner’s manual.
Match the Ambient Temperature
Next, look at the outside temperature. The AC pressure chart lists expected pressure values at different ambient temperatures. For example, if it is 85 degrees Fahrenheit outside, you would find that row on the chart and read across to see what the high side and low side pressures should be.
This is important because refrigerant pressure changes with the weather. A reading that looks normal in summer might be abnormal in winter.
Locate High Side and Low Side Values
Most charts split the data into two columns or sections:
- High side pressure (also called discharge pressure) is the pressure on the compressor outlet side.
- Low side pressure (also called suction pressure) is the pressure on the compressor inlet side.
Compare your actual AC gauge readings to these values. If your readings are far off, you have a problem to investigate.
High Side and Low Side Pressure Explained
Understanding high side pressure and low side pressure is the key to using an AC pressure chart effectively. Let us break down what each side does and what abnormal readings mean.
What Is High Side Pressure?
The high side is where the AC compressor pushes the hot, compressed refrigerant gas into the condenser coil. This side runs at high pressure and high temperature. On the AC pressure chart, high side values are usually the larger numbers.
If your high side pressure is too high, common causes include:
- A clogged condenser coil blocking airflow
- Too much refrigerant in the system
- A malfunctioning condenser fan
- High ambient temperature (which is normal to a degree)
What Is Low Side Pressure?
The low side is where the refrigerant enters the evaporator coil after passing through the thermal expansion valve or orifice tube. This side runs at low pressure and is where the magic of cooling happens. The refrigerant absorbs heat from your home’s air as it moves through the evaporator coil.
If your low side pressure is too low, common causes include:
- A refrigerant leak in the cooling system
- An undercharged AC system
- A blocked thermal expansion valve
- A failing AC compressor that cannot pull enough suction
What Does Normal Look Like?
Normal pressure readings vary depending on your refrigerant type and the outside temperature. A good rule of thumb is that the high side pressure should be roughly two to two and a half times the ambient temperature in Fahrenheit, plus 50 PSI. But always check the AC pressure chart for your specific refrigerant to be sure.
Common AC Cooling Problems and Pressure Readings
Now let us put the AC pressure chart to work. Here are some of the most common cooling problems and what the pressure readings typically tell you.
Problem 1: AC Blows Warm Air
If your AC unit is running but not cooling, low low side pressure is often the culprit. This usually means you have a refrigerant leak or the system is low on charge. Check the AC pressure chart for your refrigerant type and compare your readings. If both sides are low, you likely need to recharge the system after fixing the leak.
Problem 2: AC Runs Constantly
A system that never cycles off might have low low side pressure combined with normal or slightly high high side pressure. This pattern often points to a partial refrigerant restriction or a failing compressor that cannot pump efficiently.
Problem 3: AC Trips the Breaker
High high side pressure can cause the AC compressor to draw too much electricity and trip the breaker. A clogged condenser coil, a bad condenser fan motor, or an overcharged system are the usual suspects. Always cross-reference your readings with the AC pressure chart before adding or removing refrigerant.
Problem 4: Ice on the Evaporator Coil
If you see ice building up on the indoor evaporator coil, your low side pressure is probably too low. This restricts the thermal expansion valve and causes the coil to freeze. Check for a clogged filter, a blocked return vent, or low refrigerant levels using your AC gauge and the chart.
Step-by-Step: Using an AC Pressure Chart to Diagnose Issues
Ready to put your AC pressure chart to use? Follow these steps for a quick and accurate AC diagnostic.
Step 1: Gather Your Tools
You will need a quality AC gauge set (manifold gauge), the AC pressure chart for your refrigerant type, and a thermometer to measure the ambient temperature. Make sure your AC gauge hoses are in good condition with no leaks.
Step 2: Find the Service Ports
Locate the AC service ports on your system. The low side port is usually on the larger line between the evaporator coil and the AC compressor. The high side port is on the smaller line between the compressor and the condenser coil. Always connect to the correct port to avoid damage.
Step 3: Connect the Gauges
Attach your gauge set hoses to the service ports. Connect the blue hose to the low side and the red hose to the high side. The yellow hose goes to your refrigerant recovery or charging station if you are adding refrigerant. Let the system run for a few minutes to stabilize.
Step 4: Take Your Readings
Record the high side pressure and low side pressure from your gauges. Also note the ambient temperature outside. These two numbers are all you need to start your diagnosis.
Step 5: Compare with the AC Pressure Chart
Find your refrigerant type on the chart. Look up the row that matches your ambient temperature. Compare your actual readings to the expected values. If your readings are significantly higher or lower, you now have a starting point for your AC repair investigation.
Step 6: Investigate and Fix
Based on your comparison, dig deeper. Check for refrigerant leaks, inspect the condenser coil for debris, test the condenser fan, and evaluate the AC compressor performance. The AC pressure chart gives you the clue; now you solve the puzzle.
Expert Tips for Accurate AC Pressure Readings
Getting accurate readings from your AC pressure chart is all about the details. Here are some tips from experienced HVAC technicians that can make a big difference.
Always Let the System Stabilize
Do not take readings right after you connect the gauges. Give the system at least five to ten minutes to reach a steady state. Rushing this step leads to inaccurate refrigerant pressure readings and wrong conclusions.
Check for Sun and Wind Exposure
The ambient temperature sensor on your gauge or thermometer should be in the shade. Direct sunlight or wind can skew the reading, which throws off your comparison with the AC pressure chart.
Know Your Superheat and Subcooling
For advanced AC diagnostics, superheat and subcooling are powerful tools. Superheat measures how hot the refrigerant gas is after it leaves the evaporator coil. Subcooling measures how cool the liquid refrigerant is before it enters the expansion valve. These values help you fine-tune your refrigerant charge with precision.
Keep Your Chart Updated
Different refrigerant types have different pressure ranges. Make sure you are using the correct chart for your system. Using an R-22 chart for an R-410A system will give you completely wrong numbers and could lead to a costly mistake.
Document Everything
Keep a log of your readings over time. This helps you spot trends and catch small problems before they become big ones. A simple notebook or a phone app works great for this.
Common Mistakes to Avoid When Using an AC Pressure Chart
Even experienced people make mistakes when working with AC pressure charts. Here are the most common ones to watch out for.
- Guessing the refrigerant type: Always confirm before you connect. Mixing refrigerants can damage your HVAC system.
- Ignoring ambient temperature: The chart values change with temperature. A reading that looks wrong at 65 degrees might be perfect at 95 degrees.
- Connecting gauges to the wrong ports: This can damage your AC compressor and cause serious safety issues.
- Overcharging the system: Adding too much refrigerant based on a misread chart can hurt your cooling system and waste money.
- Skipping leak checks: If your low side pressure is low, find the leak first. Recharging without fixing the leak is a waste of time and refrigerant.
Avoiding these mistakes keeps you safe and saves you from unnecessary AC repair costs.
When to Call a Professional
While an AC pressure chart is a powerful DIY tool, there are times when you should call in a licensed HVAC technician. If you find a major refrigerant leak that you cannot locate, if your AC compressor has completely failed, or if your readings do not make sense even after double-checking, it is time to bring in the experts. Refrigerant handling also requires EPA certification in many cases, so be aware of local regulations before attempting major repairs.
That said, using the chart for basic AC diagnostics can save you hundreds of dollars in service calls. Even if you do end up calling a pro, having your own readings ready makes the conversation more productive and helps you avoid being upsold on unnecessary work.
Final Thoughts
An AC pressure chart is one of the simplest and most effective tools you can use to diagnose cooling problems fast. By understanding high side pressure, low side pressure, and how they relate to ambient temperature and refrigerant type, you can quickly narrow down the cause of most AC issues. Whether it is a simple refrigerant leak, a clogged condenser coil, or a failing compressor, the chart gives you the answers you need.
Take the time to learn your chart, invest in a good AC gauge set, and practice on your own system. The more you use it, the more confident you will become. AC pressure chart literacy is a skill that pays for itself every time you avoid an unnecessary service call or catch a small problem before it becomes a big one.
Keep this guide handy, stay curious, and remember that understanding your cooling system puts you in control of your comfort and your wallet.
What does an AC pressure chart show?
An AC pressure chart shows the expected refrigerant pressure values for different ambient temperatures. It helps you compare your actual AC gauge readings to what is normal for your specific refrigerant type.
Can I use any AC pressure chart for my system?
No. You must use the chart that matches your refrigerant type, such as R-134a, R-22, or R-410A. Using the wrong chart gives incorrect readings and can lead to poor AC diagnostics.
What should the low side pressure be on my AC?
The low side pressure varies by ambient temperature and refrigerant type. Generally, it should be lower than the high side pressure. Always check your AC pressure chart for the exact expected value at your current outdoor temperature.
Is it safe to connect AC gauges myself?
Yes, for basic pressure readings it is generally safe. Just make sure you connect to the correct service ports, wear gloves and eye protection, and never open the valves too quickly. If you plan to add or remove refrigerant, check local regulations and certifications.
What causes high side pressure to be too high?
Common causes include a clogged condenser coil, a malfunctioning condenser fan, an overcharged system, or extremely high ambient temperature. Compare your readings to the AC pressure chart to pinpoint the issue.
How often should I check my AC pressure readings?
Check your AC pressure at least once a year, ideally before the cooling season starts. Regular checks help you catch refrigerant leaks and other small problems early, saving you from costly AC repair down the road.
Frequently Asked Questions
What is ac pressure chart?
ac pressure chart is an important topic with many practical applications.